Given the primary sequence of an RNA molecule, there are numerous methods for predicting its secondary (2D) structures. To judge their accuracy, three-dimensional (3D) RNA structures solved experimentally by X-ray or NMR as deposited in the PDB are often used as benchmarks. DSSR is a handy tool to derive an RNA 2D structure from its 3D coordinates in PDB or mmCIF format. The 2D structure is specified in the dot-bracket notation (dbn), which can be fed directly into drawing programs such as VARNA for interactive display and easy generation of publication quality 2D diagrams.
Over the past few months, I’ve been asked a few times on the details of how the diagrams in the DSSR post were created. The answer is really simple, and has already been mentioned above and in the post. Here are two concrete examples to show how the process works.
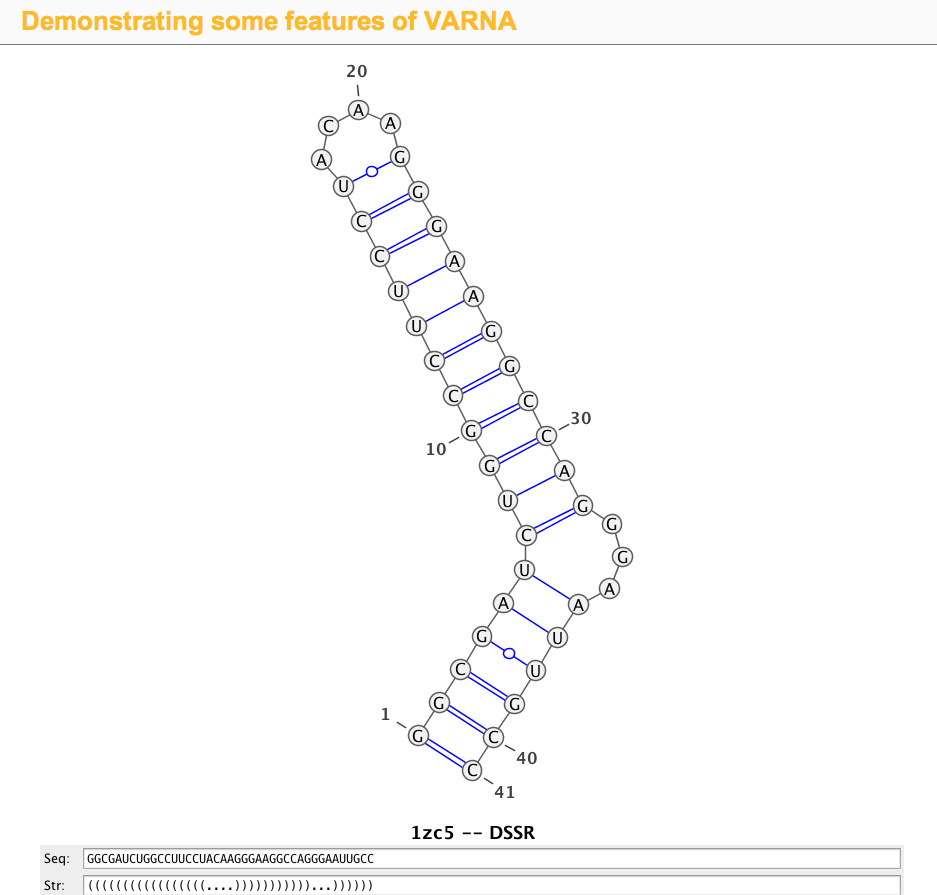
1zc5 (structure of the RNA signal essential for translational frame shifting in HIV-1)
This is the structure used in the VARNA paper. Let the PDB file be named 1zc5.pdb, the DSSR program can be run like this:
x3dna-dssr -i=1zc5.pdb
The output is sent to stdout by default, with the following three lines towards the end:
>1zc5-A #1 RNA with 41 nts
GGCGAUCUGGCCUUCCUACAAGGGAAGGCCAGGGAAUUGCC
(((((((((((((((((....)))))))))))...))))))
Simply copy and paste the last two lines (sequence and the 2D structure in dbn notation) into the Seq: and Str: fields of the VARNA demo page, the diagram will be updated automatically, as shown in the screenshot:
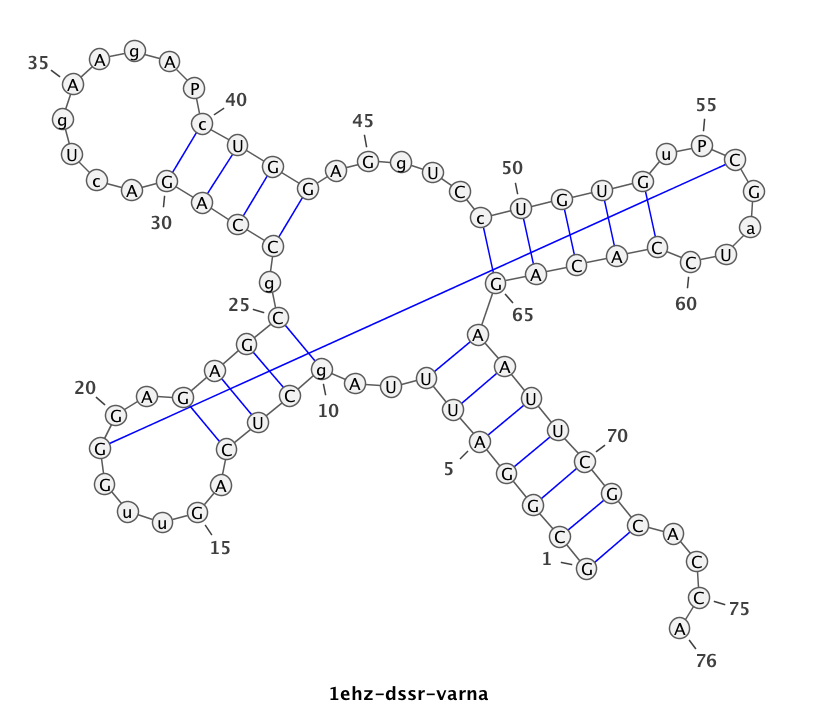
1ehz (crystal structure of yeast phenylalanine tRNA at 1.93 Å resolution)
This example (1ehz.pdb) is used to illustrate tRNA’s classic cloverleaf 2D structure. The related command and result are:
x3dna-dssr -i=1ehz.pdb -o=1ehz.out

# the output is sent to file '1ehz.out'
# towards its end are the following 3 lines

>1ehz-A #1 RNA with 76 nts
GCGGAUUUAgCUCAGuuGGGAGAGCgCCAGAcUgAAgAPcUGGAGgUCcUGUGuPCGaUCCACAGAAUUCGCACCA
(((((((..((((.....[..)))).((((.........)))).....(((((..]....))))))))))))....
I’ve used a local copy of the JAVA web start version of VARNA (VARNA-WebStart.jnlp) to generate the following 2D diagram. Here, in addition to the customized title, I have set the number period to 5 nts, adopted the simple base-pair style, and manually adjusted the T arm (upper right corner) to make the long line connecting G19 and C56 a bit more unobtrusive. Right-click to see the context menu.
Note that the G19—C56 pair creates a pseudo-knot (specified by the matching [] pair in the dbn notation above) in tRNA. I was not aware of this salient feature from previous knowledge of relevant literature. It was indeed a surprise when I first saw it in the 2D diagram.
As illustrated above, DSSR serves well as a bridge from RNA 3D to 2D structures. Give DSSR a try, you will find the program actually has much more to offer!


